
Case study 2/10
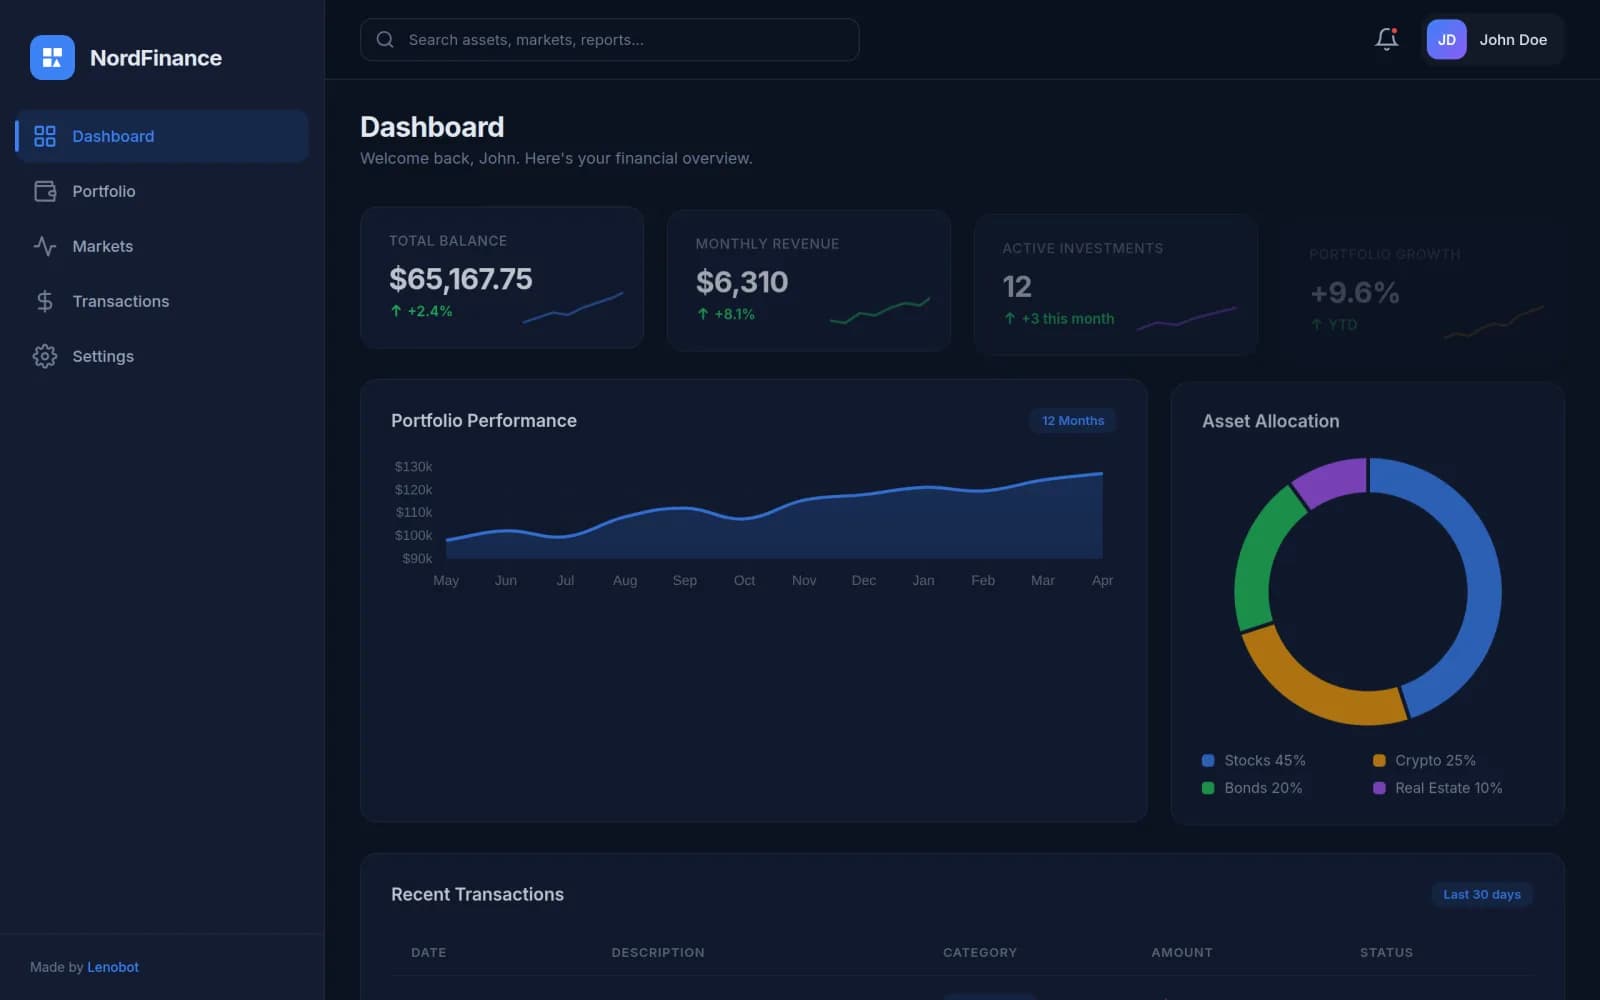
NordFinance, fintech investment dashboard
Interactive dashboard for investment portfolio management with real-time charts and transaction tracking.
- Industry
- Finance
- Type
- Dashboard
- Tech stack
- Chart.jsDark UIReal-time DataResponsive
- Live demo
- nord-finance.lenobot.com
The project
From challenge to solution
01
The challenge
Visualize complex financial data in a clear and actionable way for investors of all levels.
02
Our solution
- 01Dark mode interface with Chart.js
- 02Dynamic sparklines
- 03Interactive watchlist
- 04Real-time allocation tracking
Results
The project in numbers
Key metrics for NordFinance.
+60%
User adoption
−40%
Decision time
92%
Retention
Want a website like this one?
We check your eligibility for the 100% financed setup in just minutes.
Keep exploring